Some links

Sherlock Holmes is now in the public domain. Surprised? Here’s Wikipedia:

The Act extended these terms to life of the author plus 70 years and for works of corporate authorship to 120 years after creation or 95 years after publication, whichever endpoint is earlier.[1] Copyright protection for works published prior to January 1, 1978, was increased by 20 years to a total of 95 years from their publication date.

This law, also known as the Sonny Bono Copyright Term Extension ActSonny Bono Act, or (derisively) the Mickey Mouse Protection Act,[2] effectively “froze” the advancement date of the public domain in the United States for works covered by the older fixed term copyright rules. Under this Act, additional works made in 1923 or afterwards that were still protected by copyright in 1998 will not enter the public domain until 2019 or afterward (depending on the date of the product) unless the owner of the copyright releases them into the public domain prior to that.

Everytime I read something about copyright I come away disgusted with its power and scope.

Next up Gordon Ramsay teaches us how to scramble eggs. He’s a compelling celebrity chef, I’ll give him that.

Also see this trick using onions to cook fried eggs.

We Crush Their Spirits

I found this immensely depressing:

The number of black immigrants living in the US has increased 13-fold from 1970 to 2010, increasing their share of the black population from 1% to 10%. Black immigrants’ labor market outcomes surpass those of native blacks. This paper determines in how far the relative success of black immigrants is passed on to the second generation. While blacks of the second generation have equal or higher education and earnings levels than the first generation, the return on their unobservable characteristics is converging to that of native blacks. Race premia are put into a broader context by comparing them to Hispanics, Asians, and whites. Blacks are the only group that experiences a decrease in residual earnings when moving from the first to the second generation. Black immigrants do not only converge to native blacks across generations but also within a generation. For Asians and Hispanics, residual earnings decrease monotonically with age of immigration. For blacks, the residual earnings-age of immigration profile is upward sloping for those immigrating before the age of 15. Convergence across generations is mostly driven by low-educated second generation blacks that drop out the labor force in greater numbers than low-educated first generation immigrants do. Similarly, convergence within a generation is mostly driven by low-educated blacks who immigrate when they are young dropping out of the labor force in greater numbers than those who immigrate when they are older. A social interactions model with an assimilation parameter that varies by age of immigration helps explain this phenomenon. When making their labor force participation decision, immigrant men of all races, but not women, generally place more weight on the characteristics of natives the earlier they immigrate.

Via MR

What’s Scary about Big Data?

Here is a link to Hal Varian’s latest paper, which I haven’t read. Here is Kling:

When confronted with a prediction problem of this sort an economist would think immediately of a linear or logistic regression. However, there may be better choices, particularly if a lot of data is available. These include nonlinear methods such as 1) neural nets, 2) support vector machines, 3) classifi cation and regression trees, 4) random forests, and 5) penalized regression such as lasso, lars, and elastic nets.

In one of his examples, he redoes the Boston Fed study that showed that race was a factor in mortgage declines, and using the classification tree method he finds that a tree that omits race as a variable fits the data just as well as a tree that includes race, which implies that race was not an important factor.

I’m no fan of linear regression but at least with linear regression I know what assumptions I’m making. Multivariate linear regression is getting into scary territory but I retain the barest of grips.

Neural nets, which I’ll admit I’ve only done in a classroom setting, are a black box. Take the “proof” that Varian offers that the Boston Fed study was wrong-footed: “I can make a model with different variables that interact in ways I don’t understand that works!”. I say, holy cow, how do you have any idea you’re right.

Now I’ve not read the Boston Fed study and I haven’t read Varian’s paper or any paper he may have produced on his reanalysis of that dataset so I’m basing speculation purely on Kling’s characterization of the result.

But this sort of process and conclusion is familiar and will become more so: using really complicated tools to analyze really complicated datasets and interpreting the results in really simple ways.

Welcome to the era of big data. We are incapable of understanding anymore more than the simplest of descriptions of a dataset: mean, median, mode, percentiles. Do you understand what variance is? I sure don’t. But if can calculate it easily sometimes I can do some neat tricks with associated statistics as long as I have some underlying intuition about the data.

Multi-dimensional, massive datasets are completely non-intuitive. In catastrophe reinsurance we work every day with gigantic datasets and black box models for measuring the risks of hurricanes and earthquakes.

I like to say that the companies that build these models have a great business: they’ve built a tool that is completely non-falsifiable by humans. There are literally millions of random variables in those catastrophe models and isolating and analyzing the error is, if not impossible, at least impractical. You can’t even compare the model result of an actual historical event (say, Katrina or Sandy) with real claims data. From what I can tell talking to them about this kind of exercise, even the model builders themselves calibrate results on an aggregate basis. 

Rule #1 in my practical guide to statistics: you don’t understand aggregates.

Claims of mastery of big data modeling are hard to believe.

TV Reflects Culture

Here David Brooks is right:

I figure that unless you are in the business of politics, covering it or columnizing about it, politics should take up maybe a tenth corner of a good citizen’s mind. The rest should be philosophy, friendship, romance, family, culture and fun.

But he obviously doesn’t watch enough TV:

I wish our talk-show culture reflected that balance, and that the emotional register around politics were more in keeping with its low but steady nature.

The vast majority of TV has nothing to do with politics. Many lament this, of course, because they worry about disengagement with the political process. “If we don’t watch ’em, who will?”.

Wars aside, regular people who don’t care about politics only tune in when they get screwed over by something. You could argue (I’d sure like to) that it’s in politicians’ best interests to do as little as possible lest they rouse the ire of the silent multitude.

No Assholes in Foxholes

Here’s a good abstract:

Levitt and List (2007) conjecture that selection pressures among business people will reduce or eliminate pro-social choices. While recent work comparing students with various adult populations often fails to find that adults are less pro-social, this evidence is not necessarily at odds with the selection hypothesis, which may be most relevant for behavior in cutthroat competitive industries. To examine the selection hypothesis, we compare students with two adult populations deliberately selected from two cutthroat internet industries — domain trading and adult entertainment (pornography). Across a range of indicators, business people in these industries are more pro-social than students: they are more altruistic, trusting, trustworthy, and lying averse. They also respond differently to shame-based incentives. We offer a theory of reverse selection that can rationalize these findings.

One thing I was always struck with about the business I work in is how similar senior people at each company are. For the most part it doesn’t matter whether you’re an actuary, accountant or producer, everyone, particularly when working within their domain of expertise, is polite, smart, friendly, conscientious, well dressed and even reasonably pleasant looking.

Insurance, like others, is a social business. What’s more, the insurance industry is obsessed with moral hazard and has evolved a complex set of interrelationships among companies to suss it out. Only humans can tell if humans are playing for suckers.

These people need to get along, often while competing against each other viciously. It’s a bizarre setup and one that requires serious social skill.

For a different take, he authors of the study might have taken a hard look at asocial trading jobs. Behind the bloomberg terminal an asshole is no different than a saint and money follows talent.

But in most businesses, even the most competitive, success depends on getting along.

What Else Will Driverless Cars Do?

Help us live longer:

A few years back, Robert Ohsfeldt of Texas A&M and John Schneider of the University of Iowa asked the obvious question: what happens if you remove deaths from fatal injuries from the life expectancy tables? Among the 29 members of the OECD, the U.S. vaults from 19th place to…you guessed it…first. Japan, on the same adjustment, drops from first to ninth.

More here.

Oh, and driverless cards are actually being used at Heathrow:

Milton Keynes, a town north of London, has announced that it will be deploying 100 driverless pods (officially known as ULTra PRT transport pods) as a public transportation system. A similar system has been running for two years at Heathrow airport. The plan is to have the system up and running by 2015, with a full rollout by 2017. The move marks the first time that self-driving vehicles will be allowed to run on public roads in that country.

Will Driverless Cars Kill Insurance?

My initial thought about driverless cars was that the tort liability system will kill the whole idea. But now I’ve heard more big thinking about what it could possibly mean to have driverless cars and I’m starting to think I might have gotten it backwards.

Consider how much of what we think of as the problems with cars are not problems with the technology but problems with human behavior as expressed through the technology: poor reaction time, sleepiness, texting, drunk driving.

We drive slower, make more mistakes and keep our cars nearer to us than we would with machines behind the wheel. Most importantly, we hurt more people than machines would.

Auto insurance is about 40% of the insurance market in the US and that is mostly driven by liability insurance: what you buy to pay for harm you do to others from behind the wheel. If less harm gets done, the market will collapse, in the sense that claims cost and premium will plummet.

Good for us all, of course, but a titanic shift in the insurance landscape.

Every Rookie Makes The Same Mistake

“They were running the biggest start-up in the world, and they didn’t have anyone who had run a start-up, or even run a business,” said David Cutler, a Harvard professor and health adviser to Obama’s 2008 campaign, who was not the individual who provided the memo to The Washington Post but confirmed he was the author. “It’s very hard to think of a situation where the people best at getting legislation passed are best at implementing it. They are a different set of skills.”

That about sums up what the whole Health Exchange fiasco is about. Who put who in charge of this, anyway?

In the end, the economic team never had a chance: The president had already made up his mind, according to a White House official who spoke on the condition of anonymity in order to be candid. Obama wanted his health policy team — led by Nancy-Ann De­Parle, director of the White House Office of Health Reform — to be in charge of the law’s arduous implementation. Since the day the bill became law, the official said, the president believed that “if you were to design a person in the lab to implement health care, it would be Nancy-Ann.”

More here. I have this theory that everyone makes the same decision the first time they come upon an IT project. Can’t be that hard, right? Find someone you trust and put them in charge.

And there’s this from an MR comment:

A lot of focus has been on the front-end code, because that’s the code that we can inspect, and it’s the code that lots of amateur web programmers are familiar with, so everyone’s got an opinion. And sure, it’s horribly written in many places. But in systems like this the problems that keep you up at night are almost always in the back-end integration.

The root problem was horrific management. The end result is a system built incorrectly and shipped without doing the kind of testing that sound engineering practices call for. These aren’t ‘mistakes’, they are the result of gross negligence, ignorance, and the violation of engineering best practices at just about every step of the way..

Is The Stock Market Overvalued or Not?!

I’m too much of an efficient markets guy for that title to be entirely serious but today I’ve seen two interesting graphs and read one really deep blog post that are making me think. Here is graph 1:

If you calculate a price/earnings ratio using annual data, then in a dismal economic year like 2008 when profits are very low, the P/E ratio will spike dramatically. To avoid these somewhat meaningless short-term spikes, the Shiller P/E ratio looks the current price of stocks divided by the average profit levels over the previous 10 years, so that it is less influenced by economic conditions this year.

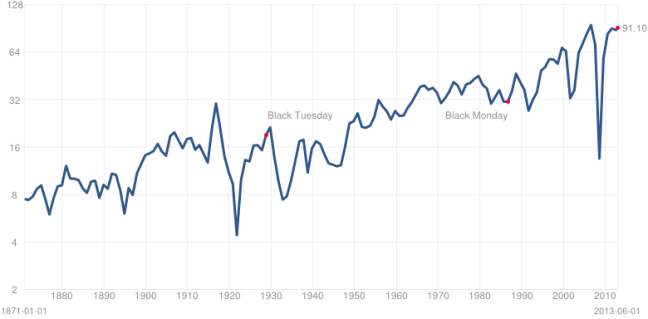
The Shiller P/E is now 24.8. As the figure shows, it is higher than at any time except the peak of the dot-com boom and its aftermath, and Black Tuesday back in 1929 at the front edge of the Great Depression. In other words, when the P/E ratio has reached this level in the past, sometimes it has gone still higher (as in the dot-com boom), but over the last 130 years it has then always fallen back.

Shiller PE Ratio Chart

The point here is that, using the price to the 10-year average profit, the stock market looks massively overvalued from a historical perspective. That post also points us to what I’ll call the Hussman post, which has a fascinating discussion on the bear case and follows up with an even better graph that takes the first one and shows (in the red line) that previous overvaluations meant horrible stock returns and vice versa.

I don’t get it. We’ve just had a lost decade where the valuation never ‘corrected’ to the levels seen between ’72 and ’90 and now we’re climbing again? Hussman also has this to say:

On careful analysis, however, the clearest and most immediate event that ended the banking crisis was not monetary policy, but the abandonment of mark-to-market accounting by the Financial Accounting Standards Board on March 16, 2009, in response to Congressional pressure by the House Committee on Financial Services on March 12, 2009. The change to the accounting rule FAS 157 removed the risk of widespread bank insolvency by eliminating the need for banks to make their losses transparent. No mark-to-market losses, no need for added capital, no need for regulatory intervention, receivership, or even bailouts.

I didn’t even know that. Anyway, here’s the next graph:

wealth

Suddenly everyone got wealthier? Price increases do ‘happen’, I guess. But why?

Back to the Hussman post for this quote:

The predictable contraction in corporate profit margins will certainly contribute, but remember that changes in corporate profits typically follow changes in combined government and household savings with a lag of 4-6 quarters, and most of the recent shift in combined savings has only occurred since the third quarter of 2012.

And now we’re at the point where I realize why I’m so lost. I don’t understand P/E ratios but I do understand profits and can see why lower consumption levels probably do mean lower profits in the short term, particularly since those higher savings levels are probably chipping away at big debts. Let’s just take that one at face value or now.

What irritates me is that those charts above tell me that I should want to live in an era with low P/E ratios. Do I?

One more chart, graphing annual corporate earnings (source):

S&P Earnings

One thing you might notice about the 80s is that that corporate earnings curve is basically totally flat. Does that sound as appealing to you? Your employer not growing?

And what is the point of the 10-year p/e, anyway? Why 10 years? Looking back at that graph of the 80s at the top, showing the 10-year return being the inverse of the valuation level, selling 10 years after the bottom of a market normally puts you square into the top of another market. And the longer those ‘tops’ last (in this case 10 years) the more ‘people’ who bought into those prolonged ‘bottoms’ sell out.

There could be a lot of bias in that 10-year measurement.

So here’s where I am:

  • I don’t understand why market valuations grew so much at the end of the 90s. I’m not afraid to climb into my armchair and say I like to think that the baby boomers had something to do with it. Could also be the great stagnation biting down since nonproductive investment defines ‘bubbles’.
  • I don’t understand why corporate profits were stagnant in the 80s, grew in the 90s and have been stagnant in the 2000s. Great stagnation?
  • I don’t understand why nobody bothers to talk about profits when analyzing the stock market as a whole. Isn’t that the point of all this?
  • I don’t understand what monetary policy has to do with any of this.
  • I definitely don’t understand what any of this means for investing. Hussman says stocks and long term treasuries are about roughly the same bet at the moment. A common prediction.

So, once again, I have seen some really neat stuff on investing and come away with nothing. How do people do this for a living?

Your Computer To Teach You

Here is a 2011 Kurt VanLehn paper (pdf) on human vs. computer systems of tutoring:

This article is a review of experiments comparing the effectiveness of human tutoring, computer tutoring, and no tutoring.  “No tutoring” refers to instruction that teaches the same content without tutoring.  The computer tutoring systems were divided by their granularity of the user interface interaction into answer-based, step-based, and substep-based tutoring systems.  Most intelligent tutoring systems have step-based or substep-based granularities or interaction, whereas most other tutoring systems (often called CAI, CBT, or CAL systems) have answer-based user interfaces.  It is widely believed as the granularity of tutoring decreases, the effectiveness increases.  In particular, when compared to No tutoring, the effect sizes of answer-based tutoring systems, intelligent tutoring systems, and adult human tutors are believed to be d = 0.3, 1.0, and 2.0 respectively.  This review did not confirm these beliefs.  Instead, it found that the effect size of human tutoring was much lower: d = 0.79. Moreover, the effect size of intelligent tutoring systems was 0.76, so they are nearly as effective as human tutoring.

One more specific result found in this paper is simply that human tutors very often fail to take advantage of what are supposed to be the advantages of human tutoring, such as flexibility in deciding how to respond to student problems.

That’s from MR. One way of thinking about this is that human instruction has a much higher variance but that in the future teachers whose skills fall below some threshold will find students switching to machines. One key will be a fair test for comparison and I worry about anti-machine prejudice.

The bottom line, of course, is that the most important ingredient in learning is motivation and the best humans will always be better motivators than machines. Only they can invoke presence with charisma and clear, relatable explanations.

Don’t count the motivating power of machine-centered instruction out totally, though. Gamification techniques feel mostly immature (at scale) and could potentially tap the competitive instincts of some.