Lat/Lon Distance Excel (Spherical Law of Cosines and Haversine Formula in Excel)

I can’t find this in one place anywhere, so I’m putting it up here:

Here’s the Haversine Formula in excel. Make sure the lat and lons are in radians (multiply degrees by pi/180)

cellx=SIN((lat2 – lat1)/2)^2+COS(lat1)*COS(lat2)*SIN((lon2-lon1)/2)^2

celly=2*Atan2(sqrt(1-cellx),sqrt(cellx)) // big trick here is that ATAN2 is reversed in Excel relative to most programming languages. Beware!

answer=celly * 6371

And the spherical law of cosines (same deal for radians. Don’t use degrees!):

=ACOS(SIN(LAT1)*SIN(LAT2)+COS(LAT1)*COS(LAT2)*COS(LON2-LON1))*6371

I’ve found the the spherical law of cosines does the trick for just about anything and is nice to have in one formula. Not that you couldn’t do the Haversine in one line, but it would be tough to look at.

___

Addendum: here’s the full excel Haversine formula in one line:

distance = 6371*2*Atan2(sqrt(1-(SIN((lat2-lat1)/2)^2+COS(lat1)*COS(lat2)*SIN((lon2-lon1)/2)^2)),sqrt(SIN((lat2-lat1)/2)^2+COS(lat1)*COS(lat2)*SIN((lon2-lon1)/2)^2))

___

Addendum 2: and here’s a google sheet you can use (and download to excel). And here is the youtube video explaining!

The New Pitchbook Paradigm

One of my pet theories is that eventually all information is going to be distributed via the “web browser stack” of technologies. Here’s what I mean by this:

Today, people in jobs like mine spend a lot of time building sales presentations. People call these different things: “decks”, “pitchbooks”, “submissions”, etc. They’re all the same thing: a summary of deal-relevant data, narrative and visualizations available in both print and electronic form distributed by email or ftp.

The technologies used are still dominated by Microsoft Office, which is probably 90% of the reason why Microsoft is in any way relevant these days. We write using Word, we analyze using Excel and Access, we present with Powerpoint and we (ugh) code in VBA. We then ‘pdf’ (verb) the documents, which is another proprietary bit of software, and email the files out.

This setup is expensive, time consuming and will one day go to the way of the Telex and the Typing Pool. Here’s tomorrow’s paradigm:

  • Write Text In HTML
  • Style in CSS
  • Distribute Information by Web Server
  • Send Data via FTP
  • Visualize With Jquery-based applications (yikes!)

The data are immutable (bye bye adobe), the odious Microsoft Word is finally slayed and email file limits are forever circumvented. Microsoft’s last stand will be with Excel, as long as it doesn’t commit upgrade suicide, which the latest version suggests is a real possibility. That program is still one of the greatest products ever developed.

One of the projects I’m taking on at work is to build parallel sales documents in HTML/CSS (Powerpoint may already be almost dead). Because I don’t want to infect my mind with the odious MS Word any more than I need to, I’ll probably build everything in HTML and write a script that translates it into Word.

Hopefully, I’ll be successful and begin to engineer a transition from the old stack to the new. We may be first movers here, folks! We’ll be so high status, clients will shower us with business.

I Already Know Where I am And I Don’t Care Where You Are

Here’s a TechCrunch article desperately trying to be breathless:

Pew: More Than A Quarter Of U.S. Adults Use Mobile And Social Location-Based Services

Which is somewhat contradicted in the article. Here’s the real story:

Pew reports that 28% of cell owners use phones to get directions or recommendations based on their current location (that works out to 23% of all U.S. adults). Only 5 percent of cell phone owners user their phone to check-in to locations using apps like Foursquare or Gowalla.

When you correct for smartphone users, the percentages climb a bit.

One in ten smartphone owners (12%) have used Foursquare, Gowalla, or a similar application and 55% of smartphone owners have used a location-based information service.

Huh, so half of all smartphone users DON’T use location services?

Social media and location services doesn’t get me excited as a businessman. At all. They both work on the following problems:

  • You don’t know where you are
  • You don’t know where you’re going
  • You’re bored and want to see what your friends are up to
  • You’re bored and want to find something to do

These are great if you’re between 15 and 30, moved to a new city or are looking for all kinds of new experiences.

Most people have lived in the same area for years/decades (they know where they are). Most people have a thousand more things to do than they need (they don’t care where you are).

The revenue model is advertising (Google wins, yeah, I get that) and the profit model is shoestring bootstrapping (ok, Amazon too). The macro effect is to enhance the superstar phenomenon for restaurants and other services in big cities.

Maybe it raises the quality of restaurant food.

Big whoop.

Toys

I’ve got two new toys and I’ve been playing with them all weekend.

First, my wife bought me a Macbook for my birthday. I’m a first-time Mac user, so old-timer Mac fanboys (I know you’re out there) will roll their eyes with an indulgent smile at the following:

Holy cow is it easier to use.

It was also a good gift in that, realistically, I needed a new computer but would never have shelled out for this thing myself.

The other new toy is a working web server (my old crappy laptop now that I’ve migrated all my development work to the Macbook) and enough PHP knowledge to compare it to my stop-and-start work with Python/Django. Again:

Holy cow is it easier to use.

There’s no question PHP was built for web development and Python for general-purpose screwing around. PHP actually requires slightly more pure programming shenanigans with the syntax (all those curly braces and semi-colons… ew), but the ability to output html right to a web page is pretty awesome. I was also able to easily translate my Python scripts, to my enduring relief.

The Mac actually seems to lack the selection of easy-to-access tools that my Windows box had, but the interface is a bajillion times easier to use. This swiping stuff is effing cool. I never imagined I would miss hotkeys so little!

Another awesome advantage is that I’m completely remote. As long as I can access my little ftp server I can work on the website from anywhere on any computer. The fact that it was ever otherwise seems faintly ridiculous now. But when you are 100% DIY with no incoming knowledge and zero budget, you forego many comforts.

Biting Off More Than You Can Chew

Here are two related posts on entrepreneurship.

The second discusses why startups fail. The biggest cause is one that plagues companies everwhere: too much scale too fast. Too much investment before you’re ready.

The first article discusses the reason why this happens:

We’re all plagued by this defect of human nature — thinking we know more than we do — which then causes us to miss opportunities to actually learn something.

And causes us to take opportunities to fail. Learning is boring and hard and embarrassing. You feel stupid, you procrastinate. You probably feel guilty about procrastinating. The smallest things are impossible to figure out.

Then you give up learning and building stuff and just lash out in activity. Bang, you’re dead.

Warning, personal rant directly ahead:

I’m still working on the weekend project and it seems that every time I turn around there’s some other super basic, super simple new thing I don’t understand that takes me forever to figure out.

For example, I’ve been completely hung up for two weeks trying to get a web server going. I have to learn how to configure Apache with Windows. Then php with Windows and Apache. None of it friggen works properly.

TWO WEEKS! And basically nothing to show for it.  Meanwhile, tweaks and improvements on the basic engine of my project languish incomplete.

But the rest works, if barely. This is the bottleneck. This where I need to spend my time.

It is an indescribably frustrating process to not even be able to SET UP my tools, much less learn to use them. I’m looking forward to learning another programming language, actually. It should go much faster this time because I’ve got the basics down fairly well.

But working in the old comfort zone isn’t going to help me, is it.

I’m Gonna Learn Me Something (I hope)

Stanford (like MIT before it) is offering a pile of classes for free online. I have the same feeling I used to get walking into a video game store. I don’t even know where to begin.

Actually, I do know where to begin:

Machine Learning

This course provides a broad introduction to machine learning and statistical pattern recognition.

Databases:

This course covers database design and the use of database management systems for applications.

I’m very excited to have signed up for these courses. I desperately hope this blog post ties me tight enough to the mast that I actually follow through.

How Computers Read Numbers

One thing that I’ve learned about computer languages is that there’s a hierarchy:

  1. High-level languages (Python) are “interpreted” into
  2. Lower-level languages (C), which are “compiled” into
  3. Assembly, which is “translated” into
  4. Machine code

Machine code is basically 1s and 0s and is mostly incomprehensible. Obviously there are rules and stuff, but it’s twilight zone.

Assembly is a step towards understandability and I’ve happened to find my way to this online book about programming in Assembly.  It’s in here that I’ve learned how computers look at numbers:

Computers use binary values because transistors can only occupy one of two states: 0 volts or 0.5 volts. 0 or 1. But how do you get real numbers from just 0s and 1s? Surprisingly, the answer is exponents:

For each “1” in the binary string, add in 2**n where “n” is the zero-based position of the binary digit. For example, the binary value 11001010 represents:

1*2**7 + 1*2**6 + 0*2**5 + 0*2**4 + 1*2**3 + 0*2**2 + 1*2**1 + 0*2**0
=
128 + 64 + 8 + 2
=
202 (base 10)

So the binary number ‘0’ means you multiply 0*2^0.

The ^0 comes in because it’s the first digit in the sequence.

’00’ would be 0 * 2^1 + 0 * 2^0 = 0.

’10’ would be 1*2^1 + 0*2^0 = 2.

Clever. It’s pretty impressive how exponents can squeeze so much information out of the ordering of 1s and 0s.

I’m not going to bother trying to figure out how they make words out of this mess today.

Fin de Poisson

Ok, probably the last post in this series. I’m finally feeling comfortable with Poisson.

Lets recap, first: one, two, three and four.

So, recall the original code that sparked all this:

algorithm poisson random number (Knuth):
    init:
         Let L ← e^−λ, k ← 0 and p ← 1.
    do:
         k ← k + 1.
         Generate uniform random number u in [0,1] and let p ← p × u.
    while p > L.
    return k − 1.

I was confused about what the e is doing in there. I think I get it, now. Here is a link to a chapter that helped me with the following (a bit):

Imagine you’re sitting in a room with Danny DeVito and Arnold Schwarzenegger is in another (identical) room. We want Arnold to walk across the room ten times and see how many steps it takes each time. BUT we can’t get into Arnold’s room. What do we do?

Well, let’s say that these are special rooms. They have been designed so that Arnold will take on average ten steps to cross the room. Now, we also know that Danny’s stride is exactly half as long as Arnold’s. The calculation becomes easy!. We tell Danny to go halfway across the room ten times and that’s our answer.

This conversion is the same idea. We know that each Poisson event takes a bit of time (length of Arnold’s strides) and that that time varies a bit. The trouble is that Arnold’s strides vary on an exponential distribution, which we can’t really model. We can model a uniform distribution easily (Danny’s strides), but we need to find a way to convert them.

We do that by picking a different distance.

Unfortunately, though, exponents really screw with your intuition here, which is why this site has been so helpful.

Think of an exponent as the amount of time a number (e) spends growing until it hits a target: say, 100. Ok, we can figure that out easily by taking the ln(100) = 4.6. But we want random nubmers, which means that e does not equal 2.71, its expected value is 2.71. But the target stays at 100, which means that our random number is actually the time e needs to grow to hit 100.

So we’ve got two random numbers, now. e is random (input) and the (output) time is random. But we can’t do random es, it’s too hard. We CAN do random uniforms (0-1), but how do we pick our target?

Well, why don’t we figure out what the expected value of the uniform is (0.5) and tell it to grow for that time=4.6 we calculated? That’s our new target!

Now things get easy. We just get this new target and generate lots of uniform random numbers to see how many it takes to hit our new target. Each time we hit the target, we write down how many uniforms it took.

Voila, each of those counts is Poisson-distributed.

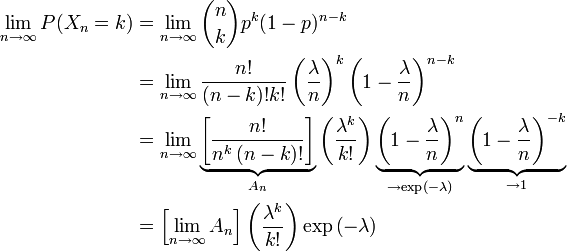
Now, back to the derivation of Poisson for a sec:

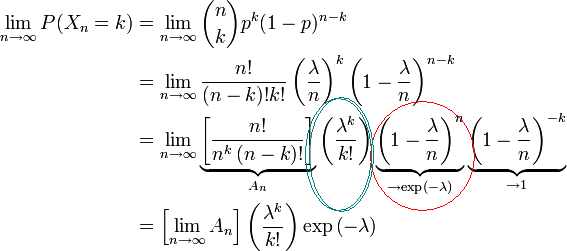
The two circled terms are the Poisson formula. I didn’t really realize how that red-circled part worked before. Look what it’s saying!

It is 1 – λ/n, which is the probability of NO event, ‘grown’ by the number of trials. In my examples above, I used events as opposed to probabilities of events. This makes no difference to the math, really, you just take the inverse of all your terms.

And now the code is clear: it just strings together a bunch of events until you hit the probability at which you know there can be no more events. And that probability is different when expressed a uniform distributed number than as an e-distributed number.

Final-e

Ok, I think I’ve finally got the whole e thing straight in my head.

They key to e, you see, is that it’s arbitrary.

First, my thought progression: one, two and three. Reading over them again, I realize how poorly I understood what was going on because those posts really suck.

Mathematicians are obsessed with two things:

  1. Shoving as much information as possible into small spaces; and,
  2. Making things look like other things without changing them

As far as I can tell, the history of mathematics is a long string of ‘discoveries’ wherin people learn some kind of identity, like this one that describes e:

and feel the faint tickle of recognition. “Hmmm…”, they would say, “now where did I see that before? Ah! Now I remember!” and ka-blammo: apples become oranges that taste like apples.

Think about the calculation of a probability using the Poisson:

This is misleadingly complex. The Poisson distribution is NOT complex. The Poisson distribution doesn’t even exist. It’s an approximation of the Binomial distribution, which is freakishly simple:

Um… ok, maybe it doesn’t look that simple but that’s because the question it’s designed to answer is a bit complicated: “what is the probability of something happening exactly k times if its probability of happening once is p and you try n times?”

The way of answering it is super easy to understand, though: for one trial the probability is p. For many trials you just start multiplying ys together with (1-p)s, mostly.

Anyway, so what’s the point of the Poisson distribution, then? Well, some clever dude realized this:

And what is all that crap. Well that crap is all about the little horizontal curly braces. These are instances where somebody recognized an equation from someplace else and plugged it in. These simplifications remove many steps in calculating the binomial distribution, but increase the difficulty of understanding it.

So e is a massive red herring here. There is no ‘deep truth’ to any of these probability distributions or to the magical math that describes them. You could express a probability using any constant other than e, it’s just that writing it out would be much more complicated and annoying.

Besides, Poisson probabilities are build around the idea of infinite trials. Infinite! There’s no such thing as infinite as far as I’m concerned.

Cute? Yes. Clever? Absolutely. “TRUE” in a deep sense of the word?

Nope.

PS. I was amazed to see what the Binomial distribution is. It’s the effing Normal distribution:

No wonder the normal distribution is such a silly concept! It only describes linear, super-simple probabilities. Hmph.

What IS The Poisson Distribution, Anyway?

I’m building a monte carlo simulator right now. This means that what I’m really doing is:

  1. Pick my statistical distributions
  2. Figure out a way of generating random numbers from those distributions.

For my (reinsurance) purposes, I am trying to answer the following questions: how many claims are there and what do they cost?

So I’ve learned to just model the frequency of claims with a poisson distribution and the severity of claims with something else: Lognormal, Beta, InverseGauss (the last is our favorite because it’s so damn obscure).

It’s one thing to use something like @risk, which has all the distributions packaged up, but what if you don’t HAVE @risk and you’re too cheap to buy it?

Well, you roll up your sleeves and find something on the Internet is what.

A problem here is that math is mostly written in another language. Here’s the formula for evaluating the probability of k things happening if you’re expecting lambda things happening:

Oh, says Donald Knuth, well you can generate random numbers for that with this:

algorithm poisson random number (Knuth):
    init:
         Let L ← e

−λ

, k ← 0 and p ← 1.
    do:
         k ← k + 1.
         Generate uniform random number u in [0,1] and let p ← p × u.
    while p > L.
    return k − 1.

Right. Well, neither of these languages is English.

That Knuth program is super interesting, though, because I feel like its constituent ideas are within my grasp. What it’s saying is that you multiply two random numbers between 0 and 1 together. If that number is higher than e^(-lambda), you multiply another. Then check again and continue until you have a number that is smaller than the e^(-lambda) threshold.

We all know the probability of two things happening together is their probability multiplied together. So each of these 0-1 random numbers has an expected value of 0.5. If you multiplied 30 of these together, because you’re expecting 30 as your lambda, you get 0.5^30.

But the distribution isn’t uniform. The higher the lambda, the bigger the left side of the distribution and so mean value sits at a progressively higher percentile. Put another way, the ratio of 0.5^lambda / e^-lambda increases.

I’m still stumped, though. I don’t understand e well enough to figure out what it’s doing to this whole thing and I want to go to bed.

Perhaps more tomorrow!